Phase 1 · Land Use & Sustainability
Satellite Land-Cover Segmentation + GHG Analysis
A fine-tuned SegFormer-B1 classifies every pixel of a satellite tile into 7 land-cover classes (val mIoU 0.5147). An emissions-factor table grounded in IPCC AR6 / EPA / EDGAR sources turns the class percentages into a tCO₂e estimate; Claude Haiku 4.5 narrates the result with inline citations.
Measurement
SegFormer-B1 fine-tuned on LoveDA. ~300 ms per 1024² tile on RTX 4070 Ti SUPER. Pixel counts only — no opinions.
Grounding
Each emissions factor cites IPCC AR6 / EPA / EIA / JRC / EDGAR. Both annual flux (tCO₂e/ha/yr) and embodied stock (tCO₂e/ha) per class.
Reasoning
Claude Haiku 4.5 with 4 tools: composition, emissions, simulate intervention, mitigation ranker. Narrates over measurements; never invents numbers.
7-class colour legend
Real inference output · held-out LoveDA tiles
SegFormer-B1 · val mIoU 0.5147Tile #2523
LoveDA-style urban/agricultural tile. SegFormer-B1 resolves building, road, water and cropland boundaries at pixel scale.
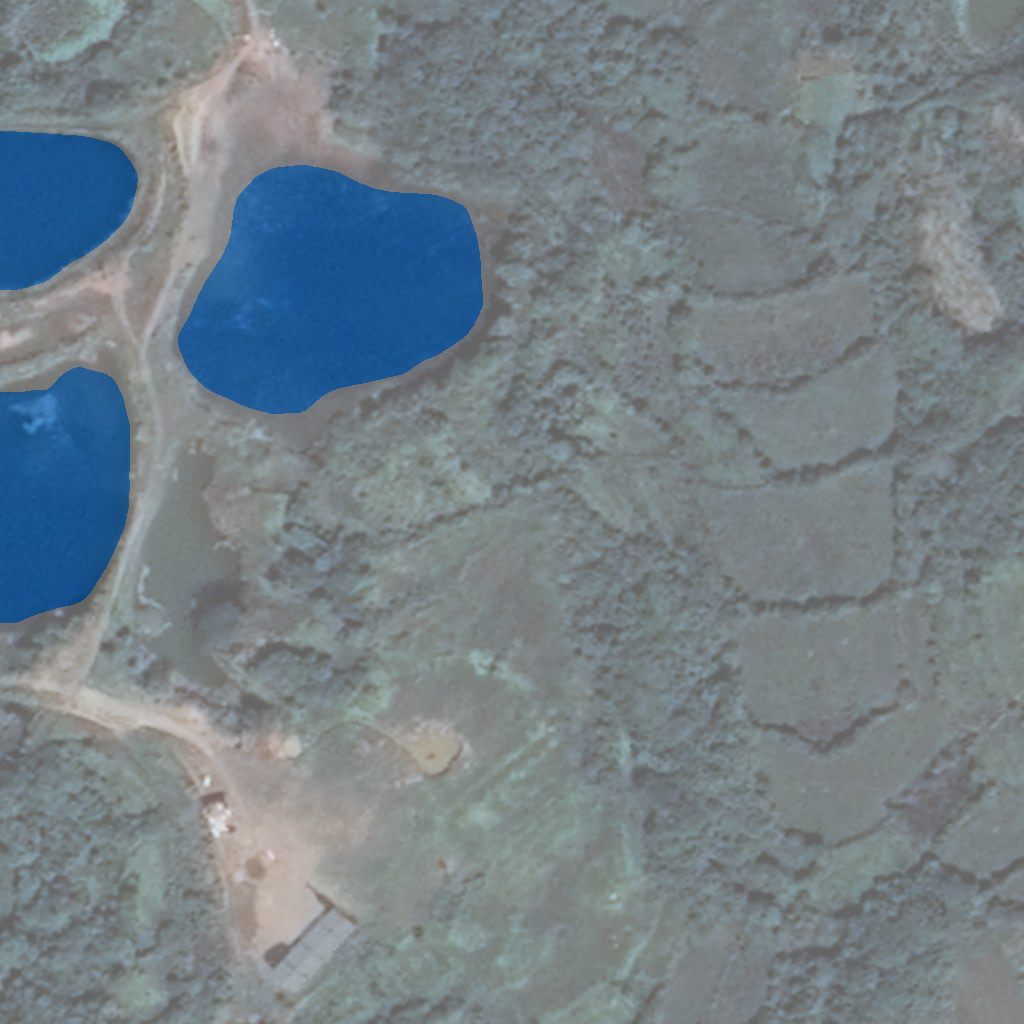

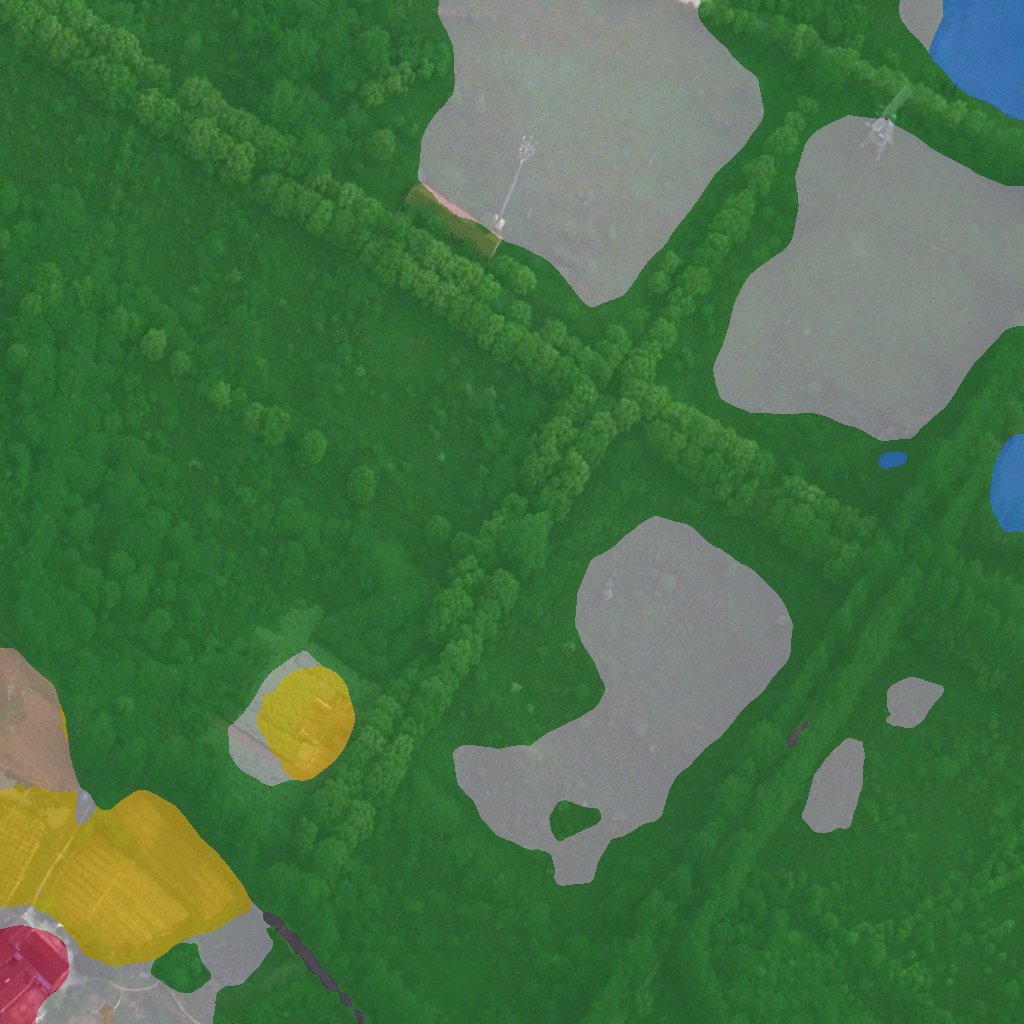
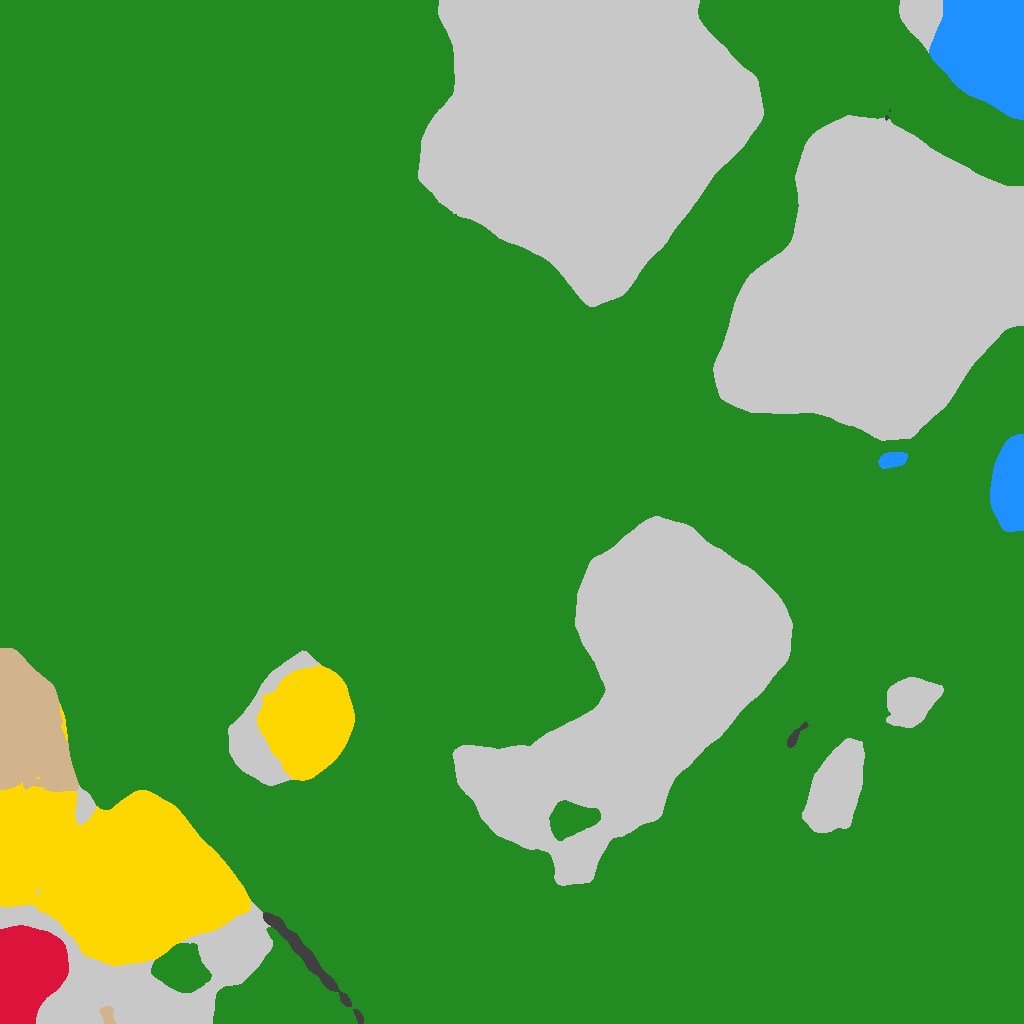
Tile #3546
Mixed rural scene. Vegetation, barren and agricultural classes drive the per-hectare emissions-factor lookup.
Interactive analyzer runs locally
The full upload-your-own-tile analyzer (FastAPI + SegFormer + the Claude agent) runs against a GPU backend on localhost:8000. The images above are real inference outputs from that pipeline. See the GitHub repo to run it end-to-end.